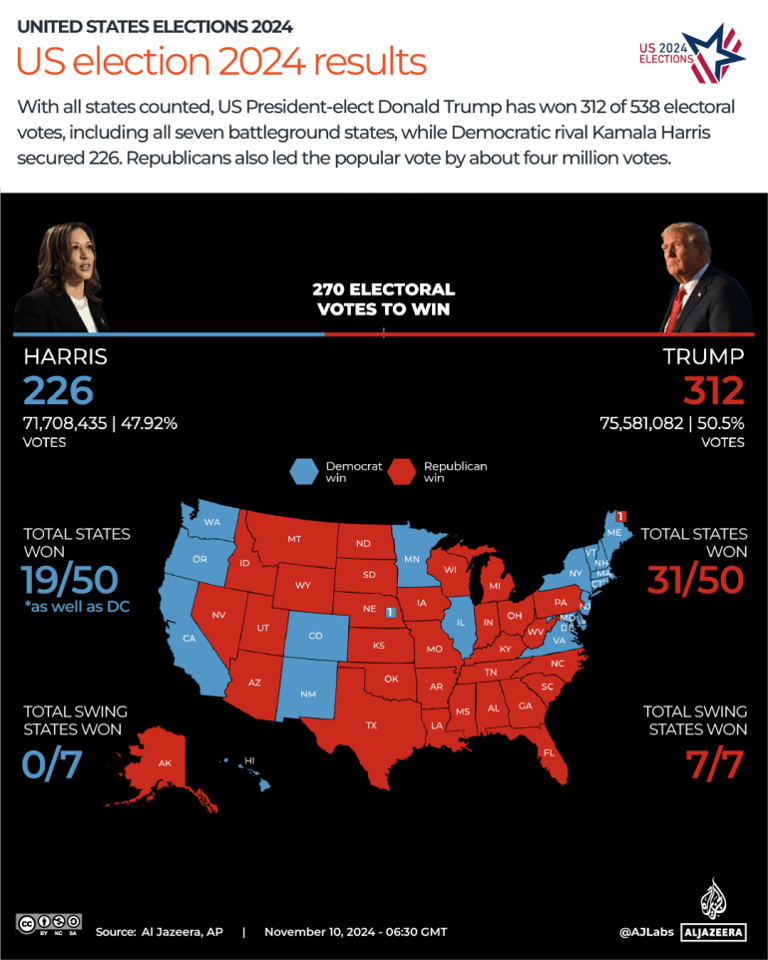
Republicans also lead the popular vote by about 4 million votes, with 95 percent of votes counted.
So, how do these results compare to 2020, and which states have shifted most to the right?
States ranked from most red to most blue
The Republicans won majorities in 31 out of the country’s 50 states with their biggest victories in Wyoming (72.3 percent), West Virginia (70.1 percent), North Dakota (67.5 percent), Idaho (66.8 percent) and Oklahoma (66.1 percent).
Meanwhile, the Democrats won 19 states as well as the capital DC where they received 92.4 percent of votes, followed by Vermont (64.3 percent), Maryland (61.5 percent), Massachusetts (61.2 percent) and Hawaii (60.6 percent).
The table below shows each state’s results, from the most Republican votes to the least with 95 percent of votes reported nationwide.
The table below shows each state’s results, from the most Republican votes to the least with 95 percent of votes reported nationwide.
Battleground state results
Leading up to the November 5 elections, pollsters identified seven battleground states with polls within a few percentage points, making them too close to call.
In the US Electoral College, a candidate needs at least 270 out of 538 Electoral votes to win the presidency.
Each state is allocated a certain number of Electoral votes based on its population. Some states consistently favour one party, making them safe for either Democrats or Republicans, while “battleground” or “swing states” can shift, making them crucial in deciding the election.
The seven battleground states, totalling 93 Electoral votes, included:
Pennsylvania (19), Georgia (16), North Carolina (16), Michigan (15), Arizona (11), Wisconsin (10) and Nevada (6).
US election results: 2020 v 2024
In 2020, Democrats, led by Joe Biden, won 306 electoral votes across 25 states and the capital, Washington, DC, while Trump secured 232 by winning the remaining 25 states.
In 2024, Donald Trump’s Republican party flipped six states to win the 2024 election.
All 50 states shifted red in 2024
Republicans have won a larger share of votes in every state in 2024 compared to 2020, with 95 percent of votes counted nationwide.
In the 2020 election, Trump received 37.74 percent of the vote in New York, while Biden secured 60.87 percent. However, in 2024, Trump earned 44.17 percent of the vote, compared to 55.83 percent for Harris. This marks the biggest shift, with a 6.43 percent change, and nearly 97 percent of the vote counted.
Other notable swings to the right include New Jersey (4.92 percent), Florida (4.88 percent), California (4.61 percent) and Massachusetts (4.38 percent).
The map below shows the percentage shift in each state across the country.


